Voted Best Answer

Jan 21, 2021 - 11:01 AM
Let's start with Automatically apply category filters.
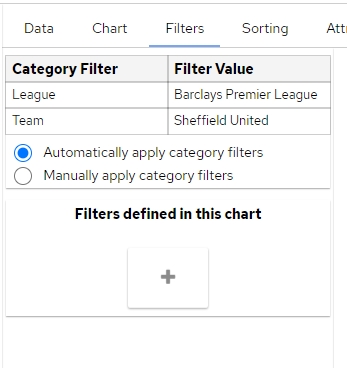
When this is selected in the filter section of the edit chart screen (which is the default behaviour), it does exactly what it says on the tin; the chart will be filtered by the selection a user makes on the category filters.
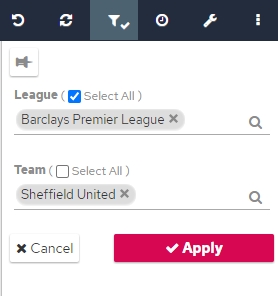
Category filter panel
![]()

Edit Chart Screen > Filters tab

In some scenarios though you don't want this to happen and this is where I'd use Manually apply category filters.
Reasons could be:
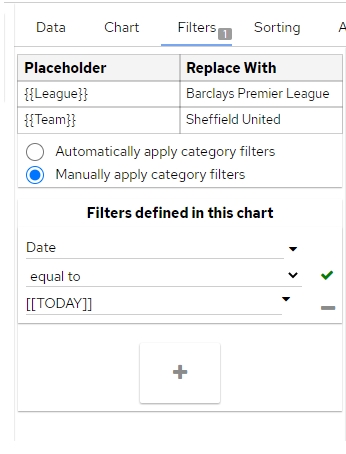
1. You want the chart to always stay as you intended and ignore the category filters the user selects. For example, a chart that will ALWAYS show today's data regardless of what date range the user selects on the category (I've sneakily used our in-built 'Magic Variables' that provide me dynamic dates too in the example)

2. You'd like to use the selected option from the category filter to interact with the chart in a different way and not a straight THIS = THIS. Examples may include: Show all items that are not equal to the item selected OR show data that is greater than the single date selected. This is where I'd use the object replacement syntax to reference what has been selected on the category. As below, this is using double curly...squiggly... erm...handlebar brackets e.g. {{value}}
In the example below, I have Team as a category filter object and can reference this in my chart filter to show teams that are not equal to the item selected (in this case, the MIGHTY Sheffield United).
I do this by referencing the said object with {{Team}}. Now whatever the user selects will be replaced into this filter item. This can be great when showing what the situation would be without a particular team, customer, department for example.

A little tip: As you can see under the Placeholder column, it's helping you to know what category objects are available to reference, so you can just copy and paste that in as I did with {{Team}} as this is case sensitive!
When this is selected in the filter section of the edit chart screen (which is the default behaviour), it does exactly what it says on the tin; the chart will be filtered by the selection a user makes on the category filters.
Category filter panel

Edit Chart Screen > Filters tab

In some scenarios though you don't want this to happen and this is where I'd use Manually apply category filters.
Reasons could be:
1. You want the chart to always stay as you intended and ignore the category filters the user selects. For example, a chart that will ALWAYS show today's data regardless of what date range the user selects on the category (I've sneakily used our in-built 'Magic Variables' that provide me dynamic dates too in the example)

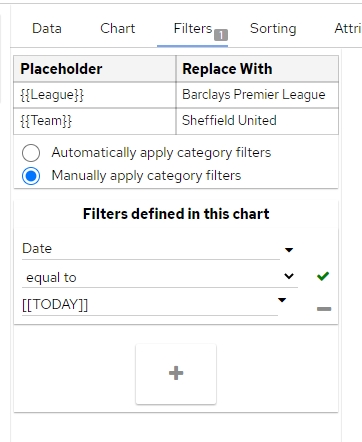
2. You'd like to use the selected option from the category filter to interact with the chart in a different way and not a straight THIS = THIS. Examples may include: Show all items that are not equal to the item selected OR show data that is greater than the single date selected. This is where I'd use the object replacement syntax to reference what has been selected on the category. As below, this is using double curly...squiggly... erm...handlebar brackets e.g. {{value}}
In the example below, I have Team as a category filter object and can reference this in my chart filter to show teams that are not equal to the item selected (in this case, the MIGHTY Sheffield United).
I do this by referencing the said object with {{Team}}. Now whatever the user selects will be replaced into this filter item. This can be great when showing what the situation would be without a particular team, customer, department for example.

A little tip: As you can see under the Placeholder column, it's helping you to know what category objects are available to reference, so you can just copy and paste that in as I did with {{Team}} as this is case sensitive!


Add New Comment